The Hennepin County MN real estate market Report in early 2026 is shifting toward a more balanced environment after years of strong seller dominance. With median home prices around $380,000, rising inventory, and homes staying on the market for nearly two months, buyers now have more negotiating power and choices. Meanwhile, rental prices averaging $1,710 continue to climb. Understanding these latest Hennepin County housing market trends is essential for buyers, sellers, and investors planning their next real estate move.

Overview of the Hennepin County Real Estate Market in 2026
In early 2026, the Hennepin County real estate market is entering a balanced phase. Previously dominated by sellers, the market now shows stabilizing prices, improving inventory, and a more deliberate pace for buyers, giving them more time and options to make informed decisions.
Shift from Seller’s Market to Balanced Conditions
For the past few years, Hennepin County’s housing market favored sellers, with homes selling quickly at top prices. In 2026, the market has become more neutral. Prices are stabilizing, listings are increasing, and buyers now have stronger negotiation power, making transactions more fair and balanced.
Factors Influencing the 2026 Housing Market
Several factors affect the 2026 market, including mortgage rates, housing supply, buyer demand, and overall economic stability. Rising inventory and slower price growth provide buyers with better opportunities while encouraging sellers to adopt competitive pricing strategies.
Key Housing Market Statistics (January 2026)
January 2026 statistics give a clear snapshot of Hennepin County’s housing market. Slight declines in prices, slower sales pace, and reduced sales volume indicate a stabilizing market and increased opportunities for buyers.
Median Sale Price Trends
The median sale price in January 2026 was $380,000, down about 1.3% compared to January 2025. This shows the market is stabilizing, with rapid price growth slowing after previous strong seller dominance.
Median Listing Price Changes
The current median listing price is $377,400, reflecting a 5.64% year-over-year decrease. This decline encourages sellers to price homes more realistically, ensuring properties do not remain on the market too long.
Days on Market
Homes are selling in an average of 50–64 days, slightly slower than last year. This provides buyers with more time to evaluate properties and negotiate effectively.
Total Home Sales Volume
| Metric | January 2025 | January 2026 |
|---|---|---|
| Homes Sold | 832 | 673 |
| Market Trend | Higher demand | Slight decline |
| Sales Change | – | Decrease |
In January 2026, 673 homes were sold, compared to 832 in January 2025, indicating a slight decrease in demand as the market balances.
Housing Inventory and Supply Trends
Increasing inventory and housing supply play a key role in balancing Hennepin County’s market. More listings give buyers better property selection and reduce extreme competition.
Active Listings and Housing Supply
The current housing supply in the metro area is approximately 2.5–3.1 months. This reflects a move toward a neutral market and a decrease in the previous seller dominance.
Growth in Residential Inventory
Active residential listings have increased by 18%. More inventory means buyers have more choices, helping balance market competition and reducing bidding wars.
New Listings Entering the Market
| Listing Data | Value | Trend |
|---|---|---|
| New Listings January 2026 | 984 | Decline |
| Change From Last Year | 14.58% decrease | Lower supply growth |
| Market Impact | Limited new supply | Stable demand |
January 2026 saw 984 new listings, a 14.58% decrease compared to the same month last year.
Buyer and Seller Dynamics in 2026
Buyer and seller behavior is also shaping market trends. Negotiation power is shifting toward buyers, while sellers increasingly use incentives to attract offers.
Negotiation Power for Buyers
The “take it or leave it” seller culture has ended. Around 19% of active listings have seen price adjustments, giving buyers more leverage in negotiations.
Seller Incentives and Concessions
Sellers are offering incentives to attract buyers, including:
- Closing cost assistance often over $5,000
- Mortgage rate buydowns
- Flexible negotiation options
- Faster closing timelines
These incentives help move inventory quickly and attract serious buyers.
Future Home Price Growth
Future home price appreciation is forecast at 1% to 2.6% annually, much lower than the double-digit growth seen in the early 2020s, reflecting a stabilized market.
Rental Market Outlook in Hennepin County
Hennepin County’s rental market remains strong. Rising rents and low vacancy rates create challenges for renters while signaling continued demand for rental properties.
Average Rental Prices
The current average rent is $1,710 per month, up 4.4% year-over-year, showing strong demand and limited rental supply.
Vacancy Rate Trends
Vacancy rates in some segments are at 10-year lows, meaning fewer units are available, keeping rents high and continuing financial pressure on renters.
Detached Home Rental Prices
| Property Type | Average Rent | Market Trend |
|---|---|---|
| All Rental Units | $1,710 | Rising |
| Detached Single-Family Homes | $2,300 | High demand |
| Rental Market | Limited supply | Strong demand |
Single-family detached homes average $2,300 per month, highlighting affordability challenges for families and long-term renters.
Hennepin County Housing Market Overview Data
Additional metrics provide deeper insight into market conditions, helping buyers and investors make informed decisions.
Homes Available for Sale
As of January 31, 2026, there were 3,018 homes for sale. This inventory provides buyers multiple options and balances competition.
New Listing Activity
There were 661 new listings as of January 31, 2026, indicating steady supply growth but at a moderate pace.
Median Sale to List Price Ratio
The median sale-to-list ratio was 1.000 (December 31, 2025), meaning homes are selling close to their list price, reflecting balanced market conditions.
Median Home Price Data
| Price Metric | Value | Date |
|---|---|---|
| Median Sale Price | $375,400 | Dec 31, 2025 |
| Median List Price | $352,250 | Jan 31, 2026 |
| Market Condition | Balanced pricing | 2026 |
These metrics show that seller and buyer expectations are gradually aligning.
Homes Selling Above or Below List Price
Approximately 33.2% of homes sold above list price, while 46.8% sold below list price, showing buyers have strong negotiating power.
Median Days to Pending
Homes take an average of 43 days to go pending (January 31, 2026), giving buyers time to evaluate properties and arrange financing.
Final Market Outlook for Buyers, Sellers, and Investors
The Hennepin County real estate market in 2026 is balanced, providing buyers with more opportunities and sellers with the need to price strategically and offer incentives. Rental demand and steady appreciation make it a promising area for long-term investors, while buyers can find more choices without intense competition. Understanding these trends is critical for anyone planning a real estate move in Hennepin County this year.
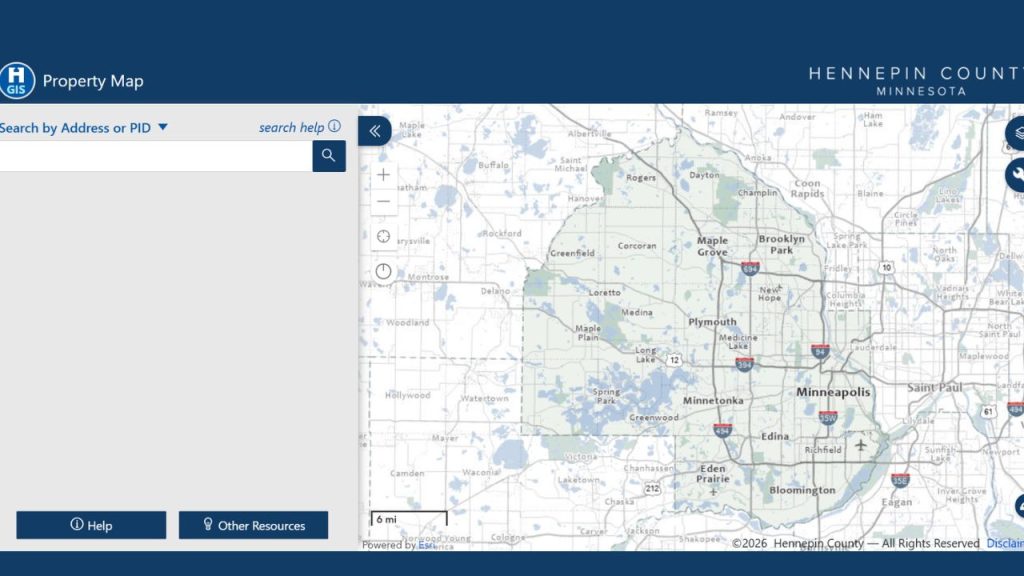
Hennepin County Real Estate Market Map 2026
Explore the Hennepin County real estate market map 2026 to view property values, housing trends, inventory levels, median prices, and Twin Cities real estate analysis for buyers, sellers, and investors.
FAQs
What is the current state of the Hennepin County real estate market in 2026?
In early 2026, the Hennepin County real estate market has shifted to a balanced phase. Home prices are stabilizing around $380,000, inventory is improving, and buyers have more negotiation power compared to previous years.
How are housing prices trending in Minnesota and the Twin Cities?
Minnesota housing market trends show modest price changes. In Hennepin County, the median listing price decreased to $377,400, and homes are selling slower, giving buyers more choices in the Twin Cities real estate market.
Where can I find a Hennepin County real estate market map for 2026?
Hennepin County real estate market maps highlight neighborhood-level data, property values, and active listings. Platforms like Zillow housing market analysis provide interactive maps and graphs to track market trends.
What are the median home prices in St. Paul and Hennepin County?
Median sale prices in Hennepin County are around $380,000. St. Paul housing market is slightly lower than the county average, offering options for buyers seeking affordability in the metro area.
How long are homes staying on the market in Hennepin County?
Homes in Hennepin County are selling in approximately 50–64 days, slightly slower than the previous year. This gives buyers additional time for property evaluation and negotiations.
What is the rental market outlook in Hennepin County and Minnesota?
The average rent in Hennepin County is $1,710 per month, with detached single-family homes averaging $2,300 per month. Vacancy rates are low, putting steady financial pressure on renters throughout the Minnesota housing market.
How can Zillow help with understanding Hennepin County real estate trends?
Zillow housing market analysis provides median prices, inventory data, sale-to-list ratios, and historical trends for Hennepin County, the Twin Cities, and broader Minnesota property markets.
Are Hennepin County property values expected to rise in 2026?
Future appreciation is forecast at a modest 1%–2.6% annually, reflecting market stabilization compared to the double-digit growth of early 2020s.
What are the top neighborhoods to watch in the Twin Cities real estate market?
Key areas include central Minneapolis, St. Paul, and suburbs with high inventory growth. Neighborhoods with active listings and price adjustments offer strategic opportunities for both buyers and investors.
How do I track Minnesota housing market trends and graphs?
Use online platforms like Zillow, Redfin, or local Hennepin County property portals for interactive housing market graphs, inventory analysis, and property value comparisons.